
Inside the
test data.
One complete recording. The measurements behind it. Explore the raw signals captured during an integrated engine ground test.
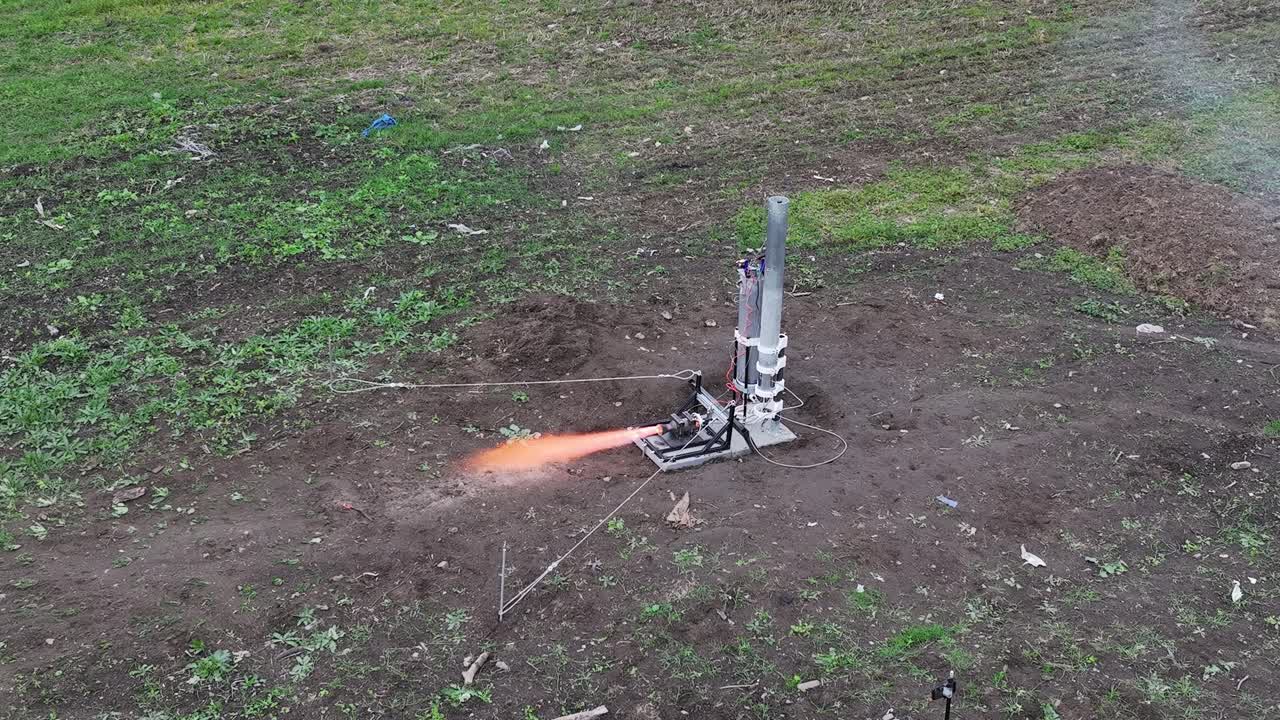
See the entire
engine test.
Open full video on YouTube Every signal.
One timeline.
Switch between sensor groups, zoom into the firing, hover to read values, or compare any two channels. Charts retain the original signals. The piston-position plot also shows a clearly labelled estimated movement line.
Compare signals
Choose any two available channels. The second channel uses the right-hand axis to preserve its scale.
Points in the sequence.
Times are read directly from state transitions in the CSV. A flag changing value does not, by itself, confirm a physical event.
Channel index.
Original column names, units, recorded ranges and missing sample counts. Select a row to compare that channel.
| CHANNEL | SIGNAL | UNIT | MIN | MAX | MISSING |
|---|
About these data. The plots use the original values and timestamps from the supplied CSV. Missing `tc2_C` readings are not drawn; `piston_mm` includes gaps. Servo and status codes are displayed as logged, without inferred actuator positions or operating states. The film is not time-synced to this CSV.